Data Analytics in Action
From Raw Data to Compelling Stories
Useful analysis starts before the code—and isn’t finished when you’ve made a chart. These four books teach you to define a meaningful problem, prepare the data with pandas, make findings clear visually, and build a persuasive story that explains their significance and suggests next steps. Practice with exercises and worked examples, then bring those skills to your own projects. Buy any two or more books in this bundle and save 50%!
Save Half
on your entire purchase when you buy any 2 or more of these books!
your total$0.00
(you save $0.00)
Save 50% when you purchase any 2 or more of these books
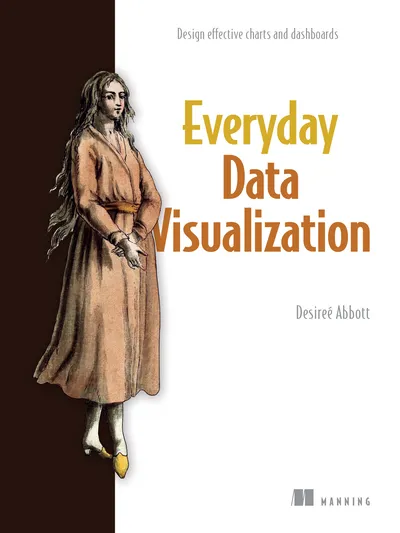
Everyday Data Visualization
Everyday Data Visualization guides you through basic graphic design for the most common types of data visualization. You’ll learn how to enhance charts with color, encourage users to interact and explore data and create visualizations accessible to everyone. Along the way, you’ll practice each new skill as you take a dashboard project from research to publication.

Pandas Workout
Pandas Workout is a thoughtful collection of practice problems, challenges, and mini-projects designed to build your data analysis skills using Python and pandas. The workouts use realistic data from many sources: the New York taxi fleet, Olympic athletes, SAT scores, oil prices, and more. Each can be completed in ten minutes or less. You’ll explore pandas’ rich functionality for string and date/time handling, complex indexing, and visualization, along with practical tips for every stage of a data analysis project.
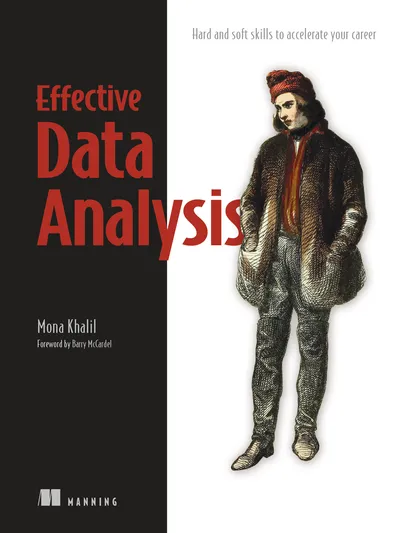
Effective Data Analysis
Effective Data Analysis helps you lock down those skills along with unfiltered insight into what the job really looks like. You’ll build out your technical toolbox with tips for defining metrics, testing code, automation, sourcing data, and more. Along the way, you’ll learn to handle the human side of data analysis, including how to turn vague requirements into efficient data pipelines. And you’re sure to love author Mona Khalil’s illustrations, industry examples, and a friendly writing style.
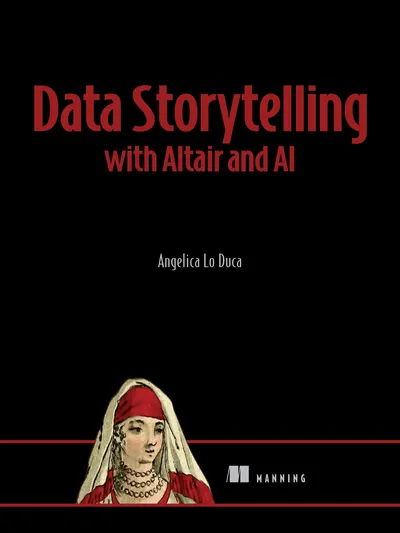
Data Storytelling with Altair and AI
Data Storytelling with Altair and AI teaches you how to build enhanced data visualizations using these tools. The book uses hands-on examples to build powerful narratives that can inform, inspire, and motivate. It covers the Altair data visualization library, along with AI techniques like generating text with ChatGPT, creating images with DALL-E, and Python coding with Copilot. You’ll learn by practicing with each interesting data story, from tourist arrivals in Portugal to population growth in the USA to fake news, salmon aquaculture, and more.
Manning Early Access Program (MEAP) - you read the book while it's being written. If you pre-order the print book, you'll get it long before it's available in stores.
