Overview
1 Understanding the language behind Power BI
DAX is presented as a functional, model-aware language that powers Power BI, Analysis Services, Excel data models, and Fabric. Unlike SQL, Python, or Excel formulas, it executes inside a live semantic model composed of tables, relationships, and metadata, and it reevaluates continuously as users interact with a report. Every slicer selection, drill, or visual state regenerates filter context and can change a result, which is why identical formulas behave differently across visuals or totals. The chapter reframes DAX as an interactive engine that operates over virtual tables and relies on relationships rather than explicit joins, building the mental model needed to predict its behavior.
DAX turns reports into responsive analytical applications: KPIs that adapt to slicers, ranking and segmentation that recalc with filters, time intelligence over custom calendars, scenario analysis via parameters and disconnected slicers, and cross-fact comparisons through shared dimensions. It exists to keep business logic correct under constant interaction, enabling authors to preserve, ignore, or override selected filters so results remain meaningful at detail, subtotal, and total levels. Use DAX when calculations must be live and context-aware, and use SQL or Power Query for data shaping and static preprocessing. A model-first learning path emphasizes visual behavior, pseudo-DAX to expose hidden filters, and a practical distinction between interactive (report-driven) DAX and standard DAX in fixed contexts, highlighting how both report authors and consumers shape evaluation without writing code.
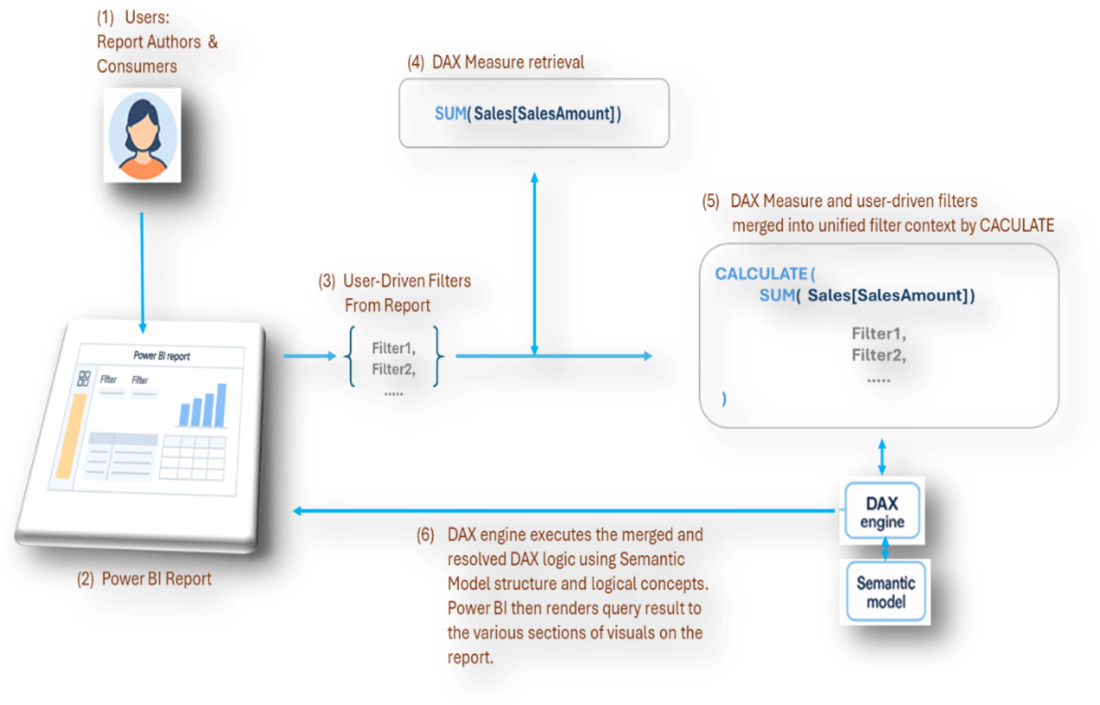
A simple aggregation such as Total Sales reveals the mechanics: as users set slicers, apply filters, or pivot rows, Power BI implicitly wraps the expression in CALCULATE, merges active filters, and evaluates the result in the current scope. Writing robust DAX begins by asking which filters should apply or be ignored and how totals should behave, then controlling context with CALCULATE and interaction-management functions such as ALL, REMOVEFILTERS, KEEPFILTERS, CROSSFILTER, and TREATAS. Mastery is the art of tracing, shaping, and stabilizing filter context—an ability that grows more critical in the era of LLMs and agentic systems, which can generate valid syntax but cannot infer model relationships, user interactions, or reporting intent. The book equips readers to diagnose, guide, and harden measures so they behave predictably, efficiently, and in line with business logic.
Summary
- DAX evaluates formulas inside a dynamic semantic model, not a static dataset.
- Power BI supplies much of the context through user interactions, visuals, slicers, and relationships.
- Interactivity is the primary reason the same DAX expression can produce different results across visuals.
- Understanding evaluation context is more important than memorizing functions.
- In the age of LLMs, MCP servers, and agentic workflows, a solid grasp of interactive DAX is essential to validate and guide AI-generated logic.
- This book teaches DAX through the lens of interactivity and model behavior, preparing you to design calculations that behave intentionally under real report usage.
FAQ
What is DAX and where is it used in the Microsoft ecosystem?
DAX (Data Analysis Expressions) is the calculation language for Power BI, Analysis Services, Excel data models, and Microsoft Fabric semantic models. It evaluates formulas inside a live semantic model, so results update as users interact with reports.How does DAX differ from SQL or Python?
SQL and Python run against fixed datasets, producing static outputs unless rerun with new inputs. DAX evaluates within a semantic model governed by relationships and filters created by visuals, slicers, and interactions. It’s functional (expression-based), uses virtual tables at evaluation time, and relies on relationships for automatic “joins.”What is the semantic model, and why does it matter for DAX?
The semantic model combines tables and relationships, metadata that controls filter flow, and measures. It determines which rows are “in scope” for a calculation. As users filter or drill, the model’s visible data changes, and DAX reevaluates your measure against that changing scope.What is filter context, and how do user actions create it?
Filter context is the set of filters active at the moment a measure is evaluated. Slicers, visual selections, drill actions, and filter panes silently add or modify filters. Each visual (and even each row in a matrix) can produce a distinct filter context, driving different results from the same measure.Why can the same measure show different results across visuals or totals?
Each visual defines its own grouping and filters, so the measure runs under different contexts. Matrix rows, subtotals, and grand totals each have unique contexts. Without managing this explicitly, totals may not match expectations; DAX provides tools to align behavior across detail and aggregate levels.When should I use DAX versus SQL or Power Query?
Use DAX when calculations must be live, context-aware, and responsive to user interaction at query time. Use SQL or Power Query for data shaping: row-by-row transforms, cleanup, schema changes, precomputed business rules, and aggregation during refresh.What does “interactive DAX” mean compared to “standard DAX”?
Interactive DAX runs inside Power BI reports where filter context is constantly reshaped by visuals and user actions. Standard DAX (e.g., in DAX Studio) runs with a controlled, static context—useful for testing, diagnostics, and understanding logic without report-driven filters.How does CALCULATE relate to visuals, slicers, and other filters?
Before evaluating a measure, Power BI effectively gathers active filters from the canvas and merges them into the evaluation context—similar to wrapping your expression in CALCULATE. This “invisible” step explains why user actions change results even when your measure formula doesn’t mention those filters.How can I control which filters affect a measure?
Use CALCULATE with filter modifiers to preserve, override, or limit filters. Functions such as ALL, REMOVEFILTERS, KEEPFILTERS, CROSSFILTER, and TREATAS let you enforce business rules (for example, fix a comparison baseline or allow only certain slicers to influence a result).Why is understanding interactivity crucial in the age of LLMs and agents?
LLMs can generate valid DAX syntax, but they don’t know your report’s slicers, filter priorities, totals behavior, relationships, or disconnected tables unless you specify them. Tools like MCP can expose metadata, but you still need a solid mental model of interactive DAX to judge, correct, and guide AI-generated measures.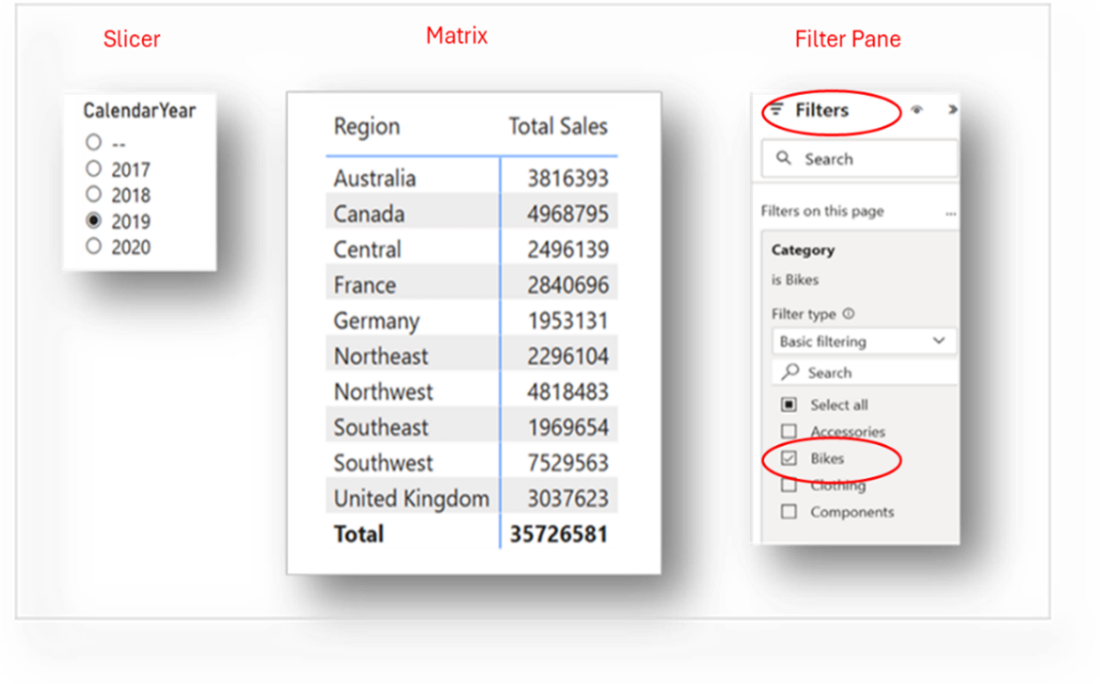
 DAX Reimagined ebook for free