This chapter introduces data science as a pragmatic, cross‑disciplinary practice focused on making and managing data‑driven decisions for business and scientific problems. Success depends less on exotic tools and more on clear, quantifiable goals, sound methodology, close collaboration, and a repeatable workflow. It emphasizes the key roles that must collaborate on a project—project sponsor, client (end‑user representative), data scientist, data architect, and operations—and stresses continual engagement with sponsors and clients, along with the data scientist’s need for domain empathy to frame the right problems and solutions.
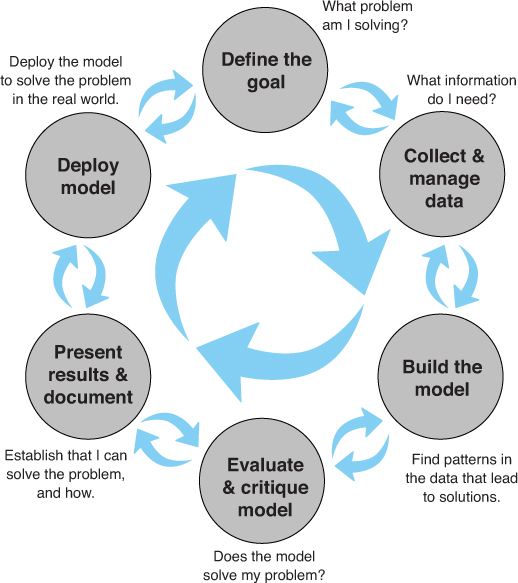
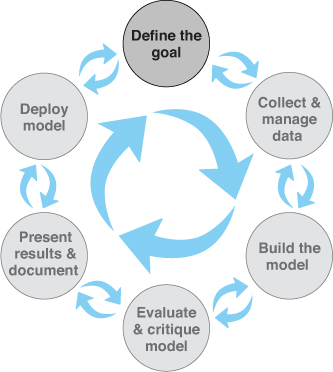
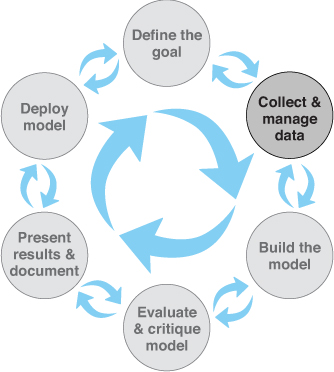
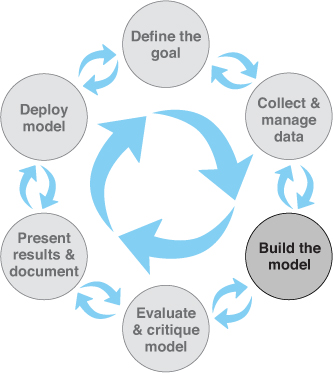
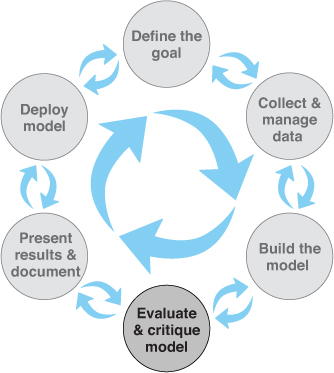
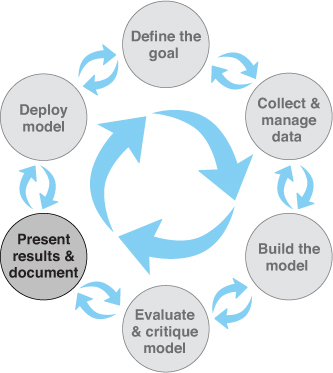
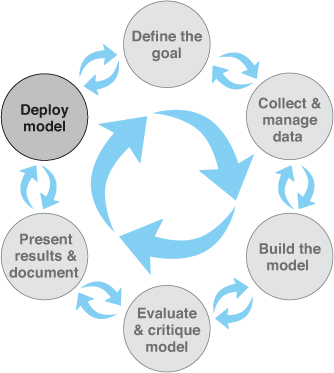
The chapter presents an iterative lifecycle rather than a rigid sequence. It begins with defining specific, measurable objectives and understanding how results will be deployed. Data collection and management then dominate the effort: identifying what data is available, assessing quality and sufficiency, exploring, cleaning, and guarding against biases (such as sampling only previously accepted cases). Modeling follows—spanning tasks like classification, scoring, ranking, clustering, relation finding, and characterization—with frequent feedback loops to earlier stages as assumptions, representations, and data needs are refined. A running example on loan risk illustrates how practical constraints, interpretability needs, and stakeholder input shape modeling choices.
Evaluation focuses on whether models meet agreed acceptance criteria and outperform obvious baselines, using measures such as precision, recall, false‑positive rates, and overall accuracy, and ensuring results make sense in context. Communication is tailored to audiences: business stakeholders care about impact on key metrics, end users need guidance on interpretation and use (including when to override), and operations needs clarity on deployment constraints and maintenance. The chapter closes by setting expectations: define lower bounds via a null model or existing process, consider base error rates and significance, and confirm that available data and resources can realistically achieve the desired performance before full execution and deployment.
The lifecycle of a data science project: loops within loops
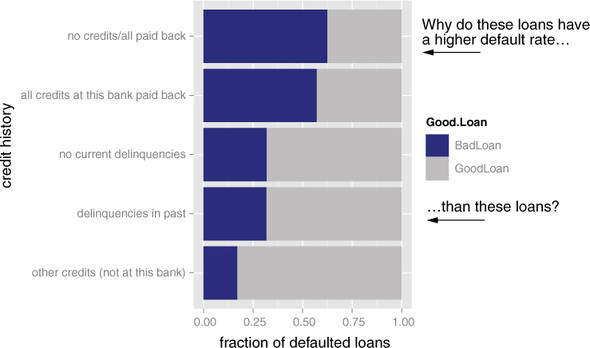
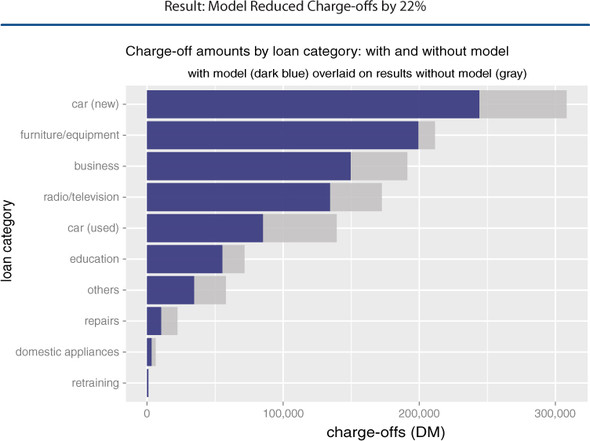
The fraction of defaulting loans by credit history category. The dark region of each bar represents the fraction of loans in that category that defaulted.
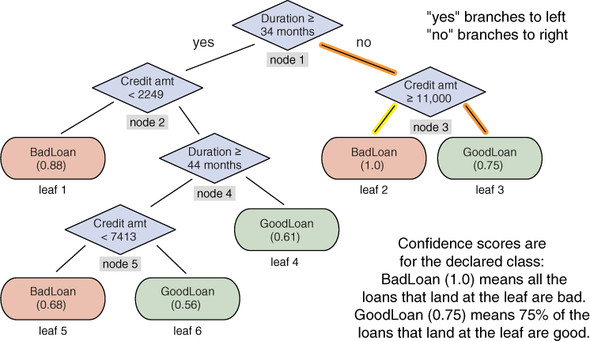
A decision tree model for finding bad loan applications. The outcome nodes show confidence scores.
Example slide from an executive presentation
Summary
The data science process involves a lot of back-and-forth—between the data scientist and other project stakeholders, and between the different stages of the process. Along the way, you’ll encounter surprises and stumbling blocks; this book will teach you procedures for overcoming some of these hurdles. It’s important to keep all the stakeholders informed and involved; when the project ends, no one connected with it should be surprised by the final results.
In the next chapters, we’ll look at the stages that follow project design: loading, exploring, and managing the data. Chapter 2 covers a few basic ways to load the data into R, in a format that’s convenient for analysis.
In this chapter you have learned
- A successful data science project involves more than just statistics. It also requires a variety of roles to represent business and client interests, as well as operational concerns.
- You should make sure you have a clear, verifiable, quantifiable goal.
- Make sure you’ve set realistic expectations for all stakeholders.
 Practical Data Science with R, Second Edition ebook for free