1 Starting to know your apps
This chapter positions troubleshooting as a core, career-defining skill for Java developers. It reframes “debugging” as just one tool within a broader practice of code investigation: understanding how software actually behaves, comparing it to how it should behave, and isolating the differences. Because most developer time goes into reading and reasoning about existing code rather than writing new lines, sharpening investigation skills yields outsized gains in speed, confidence, and autonomy across tasks like fixing defects, extending features, learning unfamiliar codebases, and avoiding future outages.
The chapter surveys when and how to investigate effectively. It highlights practical techniques such as stepping through code with a debugger for straightforward cases, using profilers to see what executes and where time is spent, adding targeted logging, and introducing controllable stubs to isolate interactions with external systems. It underscores special situations—multithreaded “Heisenbug” behaviors that shift under observation, complex frameworks that obscure control flow, and postmortem work when an app has crashed—where logs, heap dumps, and thread dumps become essential evidence. Beyond bug fixing, investigation supports learning third‑party libraries, improving performance (with I/O hot spots as frequent culprits), enhancing security and maintainability, and making sense of hard‑to‑read or legacy code.
AI is presented as a powerful accelerator, not a substitute for developer judgment: it can summarize evidence, suggest leads, and help plan next steps, while the engineer remains the detective who asks the right questions and validates results. Effective use includes crafting rich, safe prompts, guarding sensitive information, iterating based on responses, and treating outputs as hypotheses to verify. The chapter concludes with outcomes readers can expect: advanced use of debuggers, selecting the right technique for each scenario, profiling to reveal hidden behavior and performance bottlenecks, analyzing memory and thread data for failures, leveraging logging for troubleshooting and security, and applying AI to analyze code, logs, and large datasets to investigate faster and more accurately.

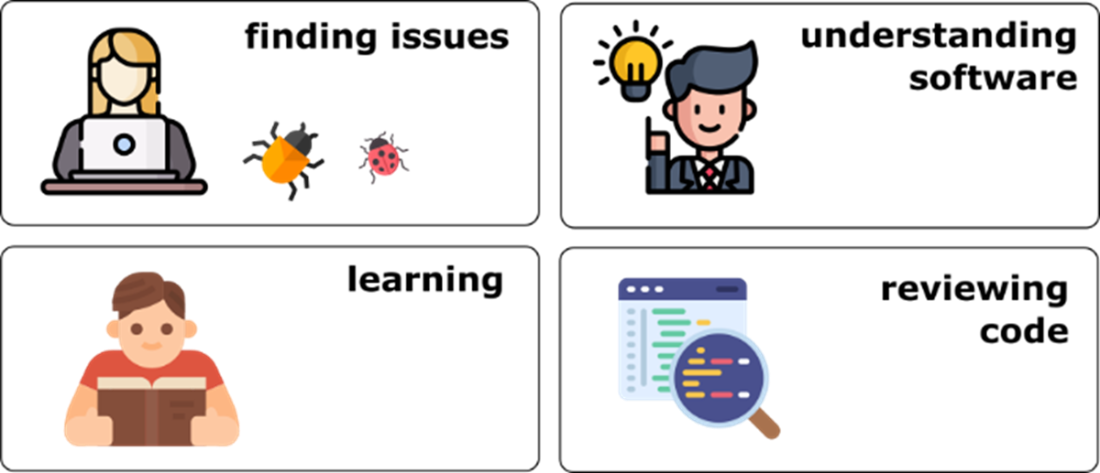
Code investigation is not only about finding problems in software. Today, apps are complex. We often use investigation techniques to understand an app’s behavior or simply to learn new technologies.
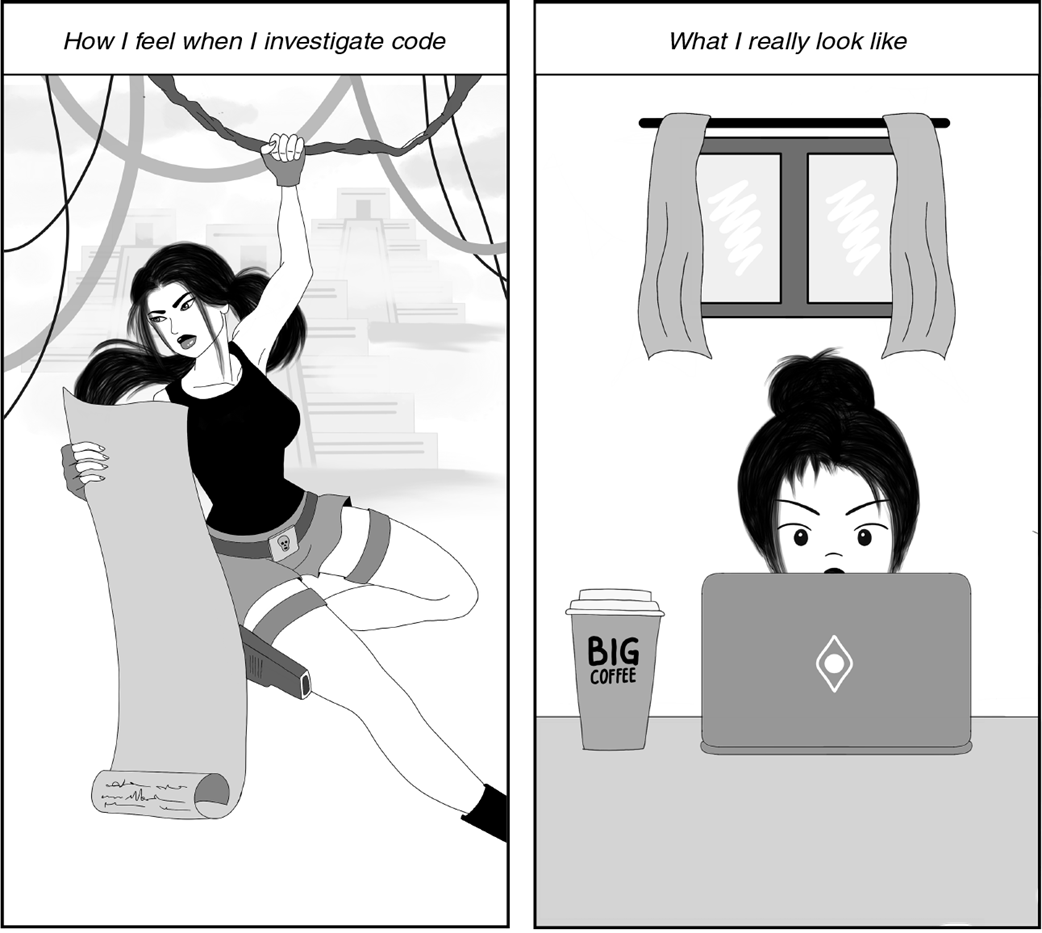
Investigating code doesn’t require much physical effort, but debugging sometimes makes you feel like Lara Croft or Indiana Jones. Many developers enjoy the unique sensation of solving the puzzle of a software issue.
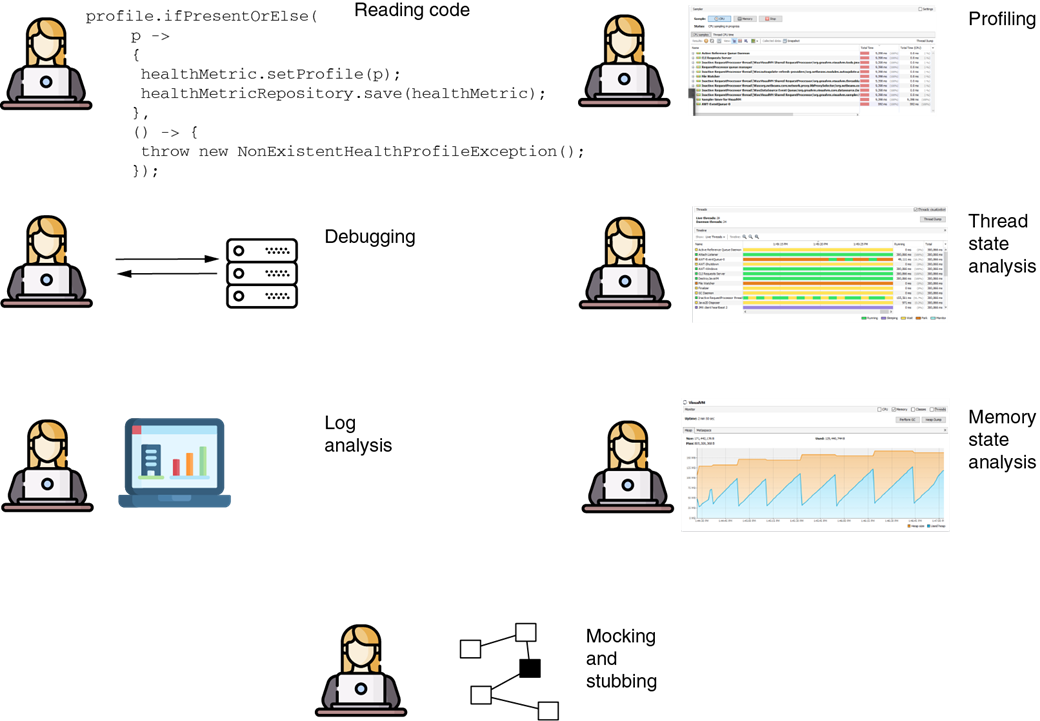
Code investigation techniques. Depending on the case, a developer can choose from one or more of these techniques to understand how a certain capability works.
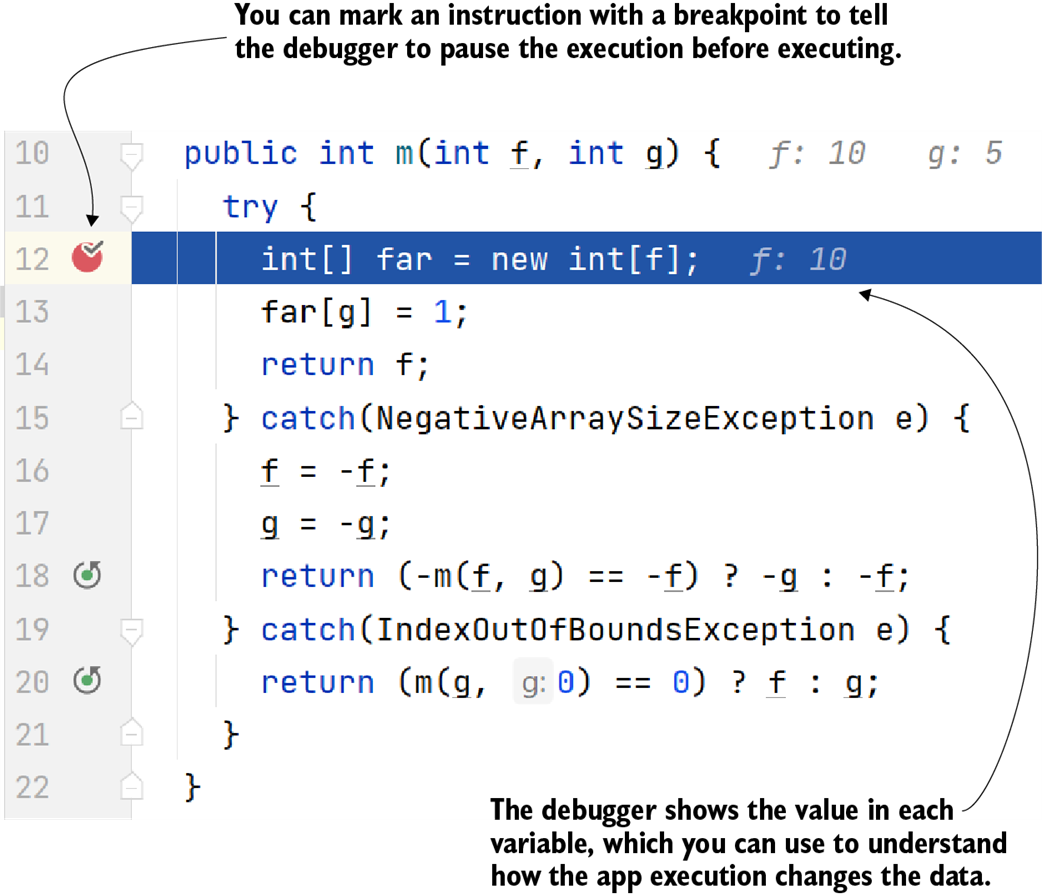
Using a debugger, you can pause the execution before a particular instruction and then observe how the app’s logic changes the data by manually running the instructions step by step.

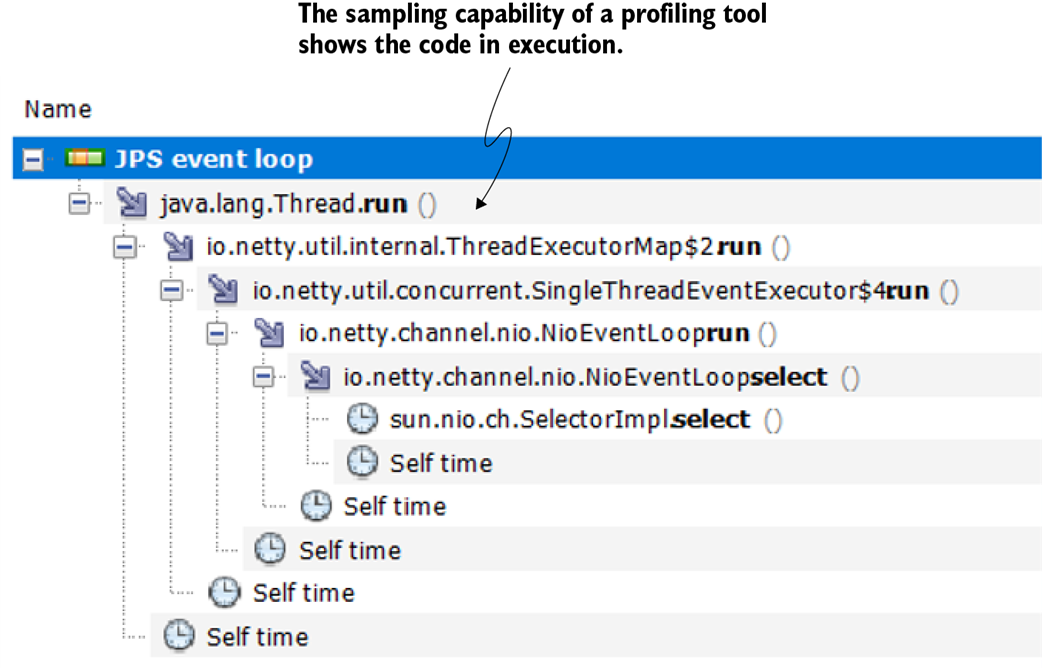
Identifying code in execution with a profiler. If you don’t know where to start debugging, the profiler can help you to identify the code that is running and give you an idea of where you can use the debugger.
A Heisenberg execution. In a multithreaded app, when a debugger interferes with the app’s execution, it might change how the app behaves. This change doesn’t allow you to correctly investigate the initial app behavior that you wanted to research.

A wrong output can be your app sending erroneous requests to another system component. You may be asked to investigate such a behavior and find its root cause.

You can replace the system component your app calls with a stub. You control the stub to determine where your app sends the request from quickly. You can also use the stub to test your solution after you correct the issue.


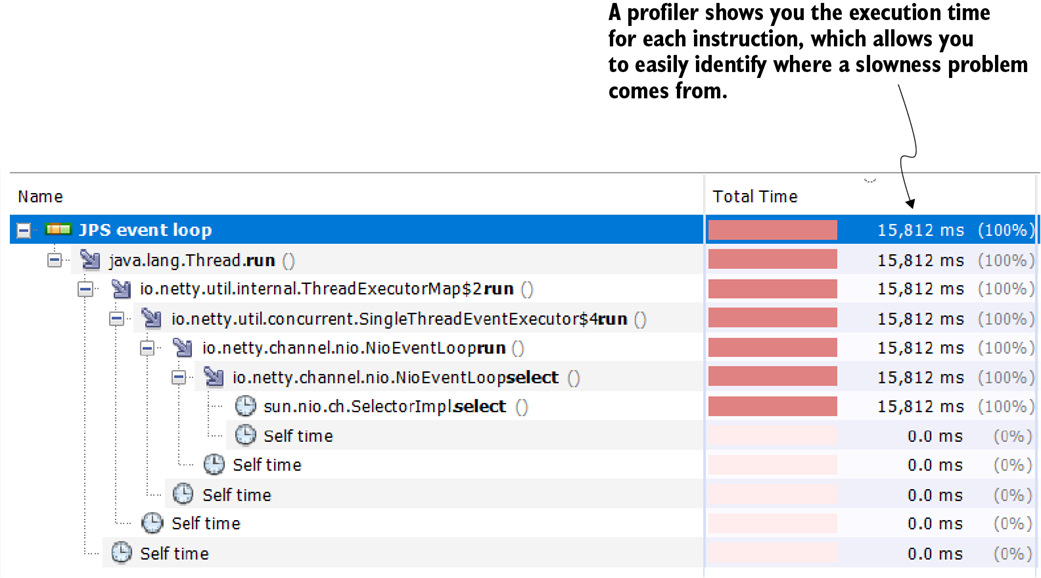
Investigating slowness problems with a profiler. The profiler shows you the time spent on each instruction during code execution. This profiler feature is excellent for identifying the root causes of performance problems.
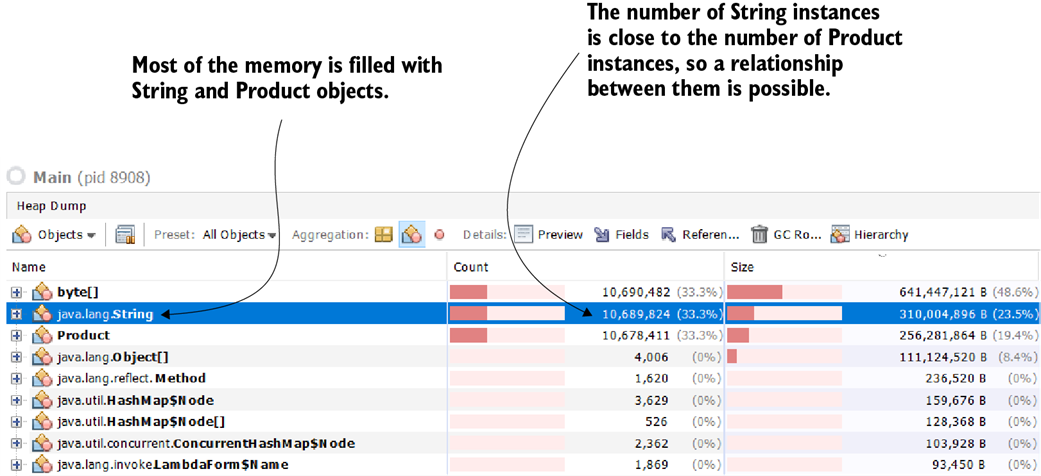
A heap dump is like a map of the heap memory. If you learn how to read it, it gives you invaluable clues about how the app internally processes data. A heap dump helps you investigate memory problems or performance issues. In this example, you can easily find which object fills most of the app’s memory and that the Product and String instances are related.
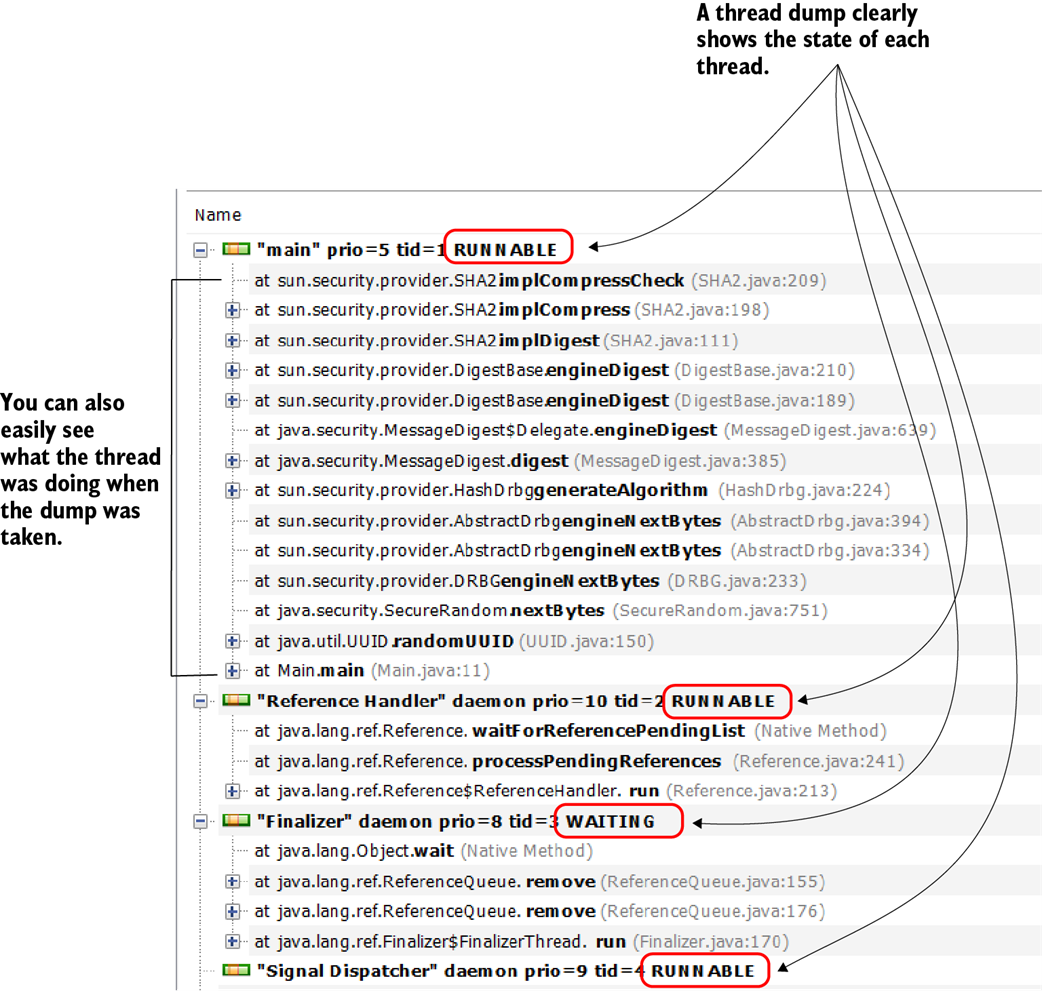
A thread dump provides details about the threads that were running when the dump was taken. It includes thread states and the stack traces, which tell you what the threads were executing or what blocked them. These details are valuable for investigating why an app is stuck or is having performance problems.
Summary
- You can use various investigation techniques to analyze software behavior.
- Depending on your situation, one investigation technique may work better than another. You need to know how to choose the correct approach to make your investigation more efficient. AI tools may prove extremely helpful to help you determine where to start from and what troubleshooting techniques to apply.
- For some scenarios, using a combination of techniques helps you to identify a problem faster. Learning how each analyzing technique works gives you an excellent advantage in dealing with complex problems.
- In many cases, developers use investigation techniques to learn new things rather than to solve problems. When learning complex frameworks such as Spring Security or Hibernate, simply reading books or the documentation isn’t enough. An excellent way to accelerate your learning is to debug examples that use a technology you want to better understand.
- A situation is easier to investigate if you can reproduce it in an environment where you can study it. Reproducing a problem not only helps you find its root cause more easily, but it also helps you to confirm that a solution works when it is applied.
 Troubleshooting Java, Second Edition ebook for free